
One of the most tantalizing questions we hear is: “Will the stock market keep going up and up forever?” Fortunately, we have a perspective on this question. “Forever” is a long time, and it includes the point when scientists believe the earth will go cold from a lack of sunlight (currently estimated at over 5 billion years 1 from now). If we shorten forever to, say, 1,000 years, we can confidently share our perspective on this question.
However, most of us likely think of the stock market as what we have lived and experienced over the past century. That’s a good time reference – as markets really grew into the form we know today over the past 100 years. How about in the centuries ahead? We believe the ever-increasing accessibility, transparency, data accuracy, and regulated accountability that stock markets offer will continue to support the ever-expanding amount of traded assets. The question is, will values continue to go up and up? Our take? For a diversified mix of equity, or stock, investments… the answer is yes, at least over the next thousand years. There are lots of details to parse out within our perspective – frankly more than we can dig into here. But let’s start with the most important: Not all stocks will go up and up forever, but we think an ever-changing mix of world-class stocks will.
The following graph is the Dow Jones Industrial Average between December 1914 (at a value of 54.63) and June 4, 2025 (at a value of 42,427).
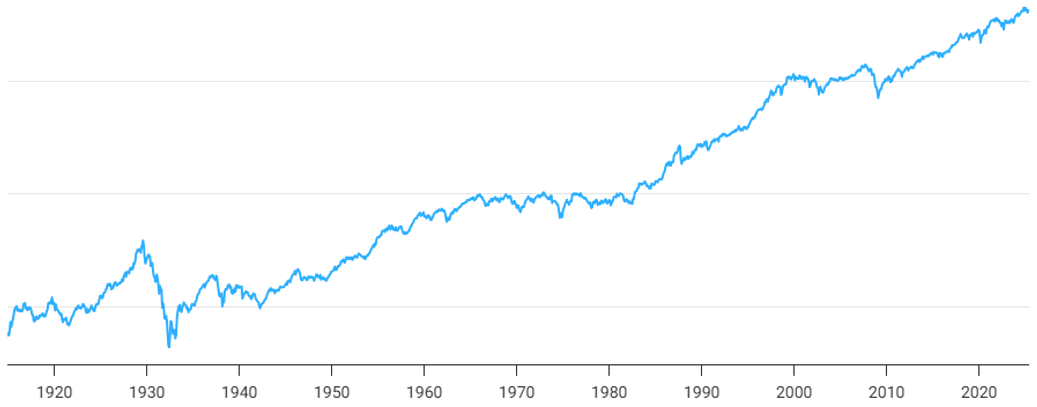
When we see this “mountain,” 3 it’s easy to wonder, “How can it just keep going up and up?” Let’s stay with this question.
We should think of the mix of these companies as ever-changing. Let’s consider two well-known benchmarks, The Dow Jones Industrial Average and the S&P 500 Index. Charles Dow and Edward Jones partnered up and started publishing an index on May 26, 1896. The index followed the 12 largest stocks of each sector (area) of the US stock market. 3 The value for the index on that first day was just shy of 41 (whereas what has morphed into the Dow Jones Industrial Average is now in the 40,000 area). 4 Speaking to the concept of an ever-changing mix of stocks, none of the original 12 are found in the index today, which now includes 30 stocks. If we look at the larger (by company count) S&P 500, it currently follows the value of approximately 500 of the largest companies listed on the US stock exchanges. It started in 1923 and initially followed the value of 233 companies, tracked weekly, before expanding to 500 in 1957. 5 By our estimate, less than 60 of the original 233 stocks remain in the S&P 500 more than 100 years later. That means that about 75% of the firms are new to the index over the past century. According to a study by McKinsey, the average lifespan of a company in the S&P 500 was estimated at 61 years in 1958. As of 2021, it was 16 years. 6 That would suggest, on average, about 6% of the 500 companies change out each year, based upon the substitutions Stand and Poor’s makes each quarter. Here is the key point: Yes, we think the stock market will trend higher over the next thousand years – but, the companies making the journey will certainly change – and, importantly, so will the companies we invest in.
When we see charts, or see values of 40,000, it’s human nature to think of this as a singular item – and how on earth could a singular item just grow and grow? Every business – or, to leap to biology, every tree – can only increase (grow) so much…right? After all, haven’t we all been taught “What goes up, must come down”? Fortunately, as we explained, the stock market is not a singular item. It is a very broad mix of thousands and thousands of businesses. In fact, the investments we use are even more focused – and we’re guided towards what we think are the better businesses or stocks available. Let’s flip to a very useful sports analogy to help bring this perspective together.
If you think of one of your favorite professional sports teams, you know that from year to year the team can go through a tough season or two. But, if that professional sports team were to compete with a college/high-school team, there would likely be a decisive win for the professional team. Just substitute in “world-class company” for the professional team and instead of sports – it’s business. These companies are pros at what they do. Staying with the sports analogy a bit longer – what are the odds that if you fast forward ten years that your team will still be competitive? How about in a hundred years? How about in a thousand years? It doesn’t feel irrational to predict that a professional team in a thousand years will be better than a college/high-school team. And, just as the specific players change on the team, the companies we invest in will change. But the important point is that the team will endure and so will the stock market.
1 When Will The Sun Die? JoAnna Wendel, published January, 7, 2022. Space.com.
2 https://www.macrotrends.net/1319/dow-jones-100-year-historical-chart
3 https://www.investopedia.com/ask/answers/100214/when-did-dow-jones-industrial-average-djia-begin.asp
4 Ibiid
5 https://en.wikipedia.org/wiki/S%26P_500
6 https://www.investopedia.com/articles/investing/090414/sp-500-index-you-need-know.asp
There is no assurance that the views or strategies discussed are suitable for all investors or will yield positive outcomes. Investing involves risks including possible loss of principal. Any economic forecasts set forth may not develop as predicted and are subject to change.
References to markets, asset classes, and sectors are generally regarding the corresponding market index. Indexes are unmanaged statistical composites and cannot be invested into directly. Index performance is not indicative of the performance of any investment and do not reflect fees, expenses, or sales charges. All performance referenced is historical and is no guarantee of future results.
All data is provided as of June 27, 2025.
Any company names noted herein are for educational purposes only and not an indication of trading intent or a solicitation of their products or services. LPL Financial doesn’t provide research on individual equities.
The Standard & Poor’s 500 Index (S&P500) is a capitalization-weighted index of 500 stocks designed to measure performance of the broad domestic economy through changes in the aggregate market value of 500 stocks representing all major industries.
This Research material was prepared by LPL Financial, LLC. All information is believed to be from reliable sources; however, LPL Financial makes no representation as to its completeness or accuracy.
Professionals associated with The Perspective Group may be either (1) registered representatives with, and securities offered through LPL Financial, Member FINRA/SIPC, and offer advisory services through The Perspective Group, a registered investment advisor; or (2) solely tax professionals of The Perspective Group, and not affiliated with LPL Financial. Tax related services offered through The Perspective Group, a separate legal entity, and not affiliated with LPL Financial. LPL Financial does not offer tax advice or Tax related services.