The U.S. initial public offering (IPO) market appears to be entering one of its most consequential periods in years. After a long drought following the 2021 issuance boom, a healthier macro backdrop, improved risk appetite, and a long queue of mature private companies have reopened the new-issue window. The potential 2026 class is unusual not only because of the number of companies considering public listings, but because several would be large enough to matter for major equity indexes, passive fund flows, and the broader market narrative around artificial intelligence.
Category: Uncategorized
Outlook 2026: The Policy Engine
In this report, detailed charts and graphs help illustrate the 2026 outlook for the economy, stocks, the midterms, bonds, alternative investments, currencies, and commodities.
Outlook 2026: Executive Summary
THE YEAR 2025 was a good example of the prevailing regime. That is, we are witnessing markets that are driven less by fundamentals and traditional business-cycle dynamics and more by fiscal and monetary policy influence. As fundamentals have taken the back seat, policy decisions have emerged as one of the most impactful forces driving market direction.
What does that mean for 2026?
Will The Stock Market Go Up Forever?
One of the most tantalizing questions we hear is: “Will the stock market keep going up and up forever?” Fortunately, we have a perspective on this question. “Forever” is a long time, and it includes the point when scientists believe the earth will go cold from a lack of sunlight (currently estimated at over 5 billion years 1 from now). If we shorten forever to, say, 1,000 years, we can confidently share our perspective on this question.
However, most of us likely think of the stock market as what we have lived and experienced over the past century. That’s a good time reference – as markets really grew into the form we know today over the past 100 years. How about in the centuries ahead? We believe the ever-increasing accessibility, transparency, data accuracy, and regulated accountability that stock markets offer will continue to support the ever-expanding amount of traded assets. The question is, will values continue to go up and up? Our take? For a diversified mix of equity, or stock, investments… the answer is yes, at least over the next thousand years. There are lots of details to parse out within our perspective – frankly more than we can dig into here. But let’s start with the most important: Not all stocks will go up and up forever, but we think an ever-changing mix of world-class stocks will.
The following graph is the Dow Jones Industrial Average between December 1914 (at a value of 54.63) and June 4, 2025 (at a value of 42,427).
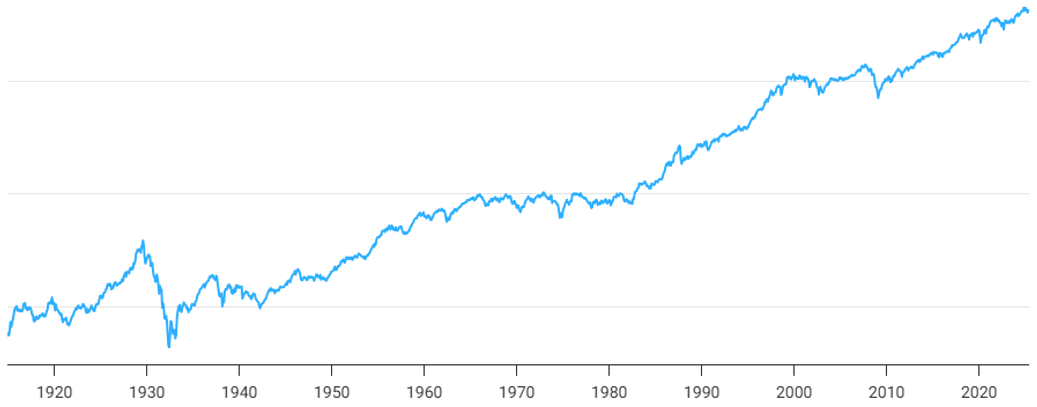
When we see this “mountain,” 3 it’s easy to wonder, “How can it just keep going up and up?” Let’s stay with this question.
We should think of the mix of these companies as ever-changing. Let’s consider two well-known benchmarks, The Dow Jones Industrial Average and the S&P 500 Index. Charles Dow and Edward Jones partnered up and started publishing an index on May 26, 1896. The index followed the 12 largest stocks of each sector (area) of the US stock market. 3 The value for the index on that first day was just shy of 41 (whereas what has morphed into the Dow Jones Industrial Average is now in the 40,000 area). 4 Speaking to the concept of an ever-changing mix of stocks, none of the original 12 are found in the index today, which now includes 30 stocks. If we look at the larger (by company count) S&P 500, it currently follows the value of approximately 500 of the largest companies listed on the US stock exchanges. It started in 1923 and initially followed the value of 233 companies, tracked weekly, before expanding to 500 in 1957. 5 By our estimate, less than 60 of the original 233 stocks remain in the S&P 500 more than 100 years later. That means that about 75% of the firms are new to the index over the past century. According to a study by McKinsey, the average lifespan of a company in the S&P 500 was estimated at 61 years in 1958. As of 2021, it was 16 years. 6 That would suggest, on average, about 6% of the 500 companies change out each year, based upon the substitutions Stand and Poor’s makes each quarter. Here is the key point: Yes, we think the stock market will trend higher over the next thousand years – but, the companies making the journey will certainly change – and, importantly, so will the companies we invest in.
When we see charts, or see values of 40,000, it’s human nature to think of this as a singular item – and how on earth could a singular item just grow and grow? Every business – or, to leap to biology, every tree – can only increase (grow) so much…right? After all, haven’t we all been taught “What goes up, must come down”? Fortunately, as we explained, the stock market is not a singular item. It is a very broad mix of thousands and thousands of businesses. In fact, the investments we use are even more focused – and we’re guided towards what we think are the better businesses or stocks available. Let’s flip to a very useful sports analogy to help bring this perspective together.
If you think of one of your favorite professional sports teams, you know that from year to year the team can go through a tough season or two. But, if that professional sports team were to compete with a college/high-school team, there would likely be a decisive win for the professional team. Just substitute in “world-class company” for the professional team and instead of sports – it’s business. These companies are pros at what they do. Staying with the sports analogy a bit longer – what are the odds that if you fast forward ten years that your team will still be competitive? How about in a hundred years? How about in a thousand years? It doesn’t feel irrational to predict that a professional team in a thousand years will be better than a college/high-school team. And, just as the specific players change on the team, the companies we invest in will change. But the important point is that the team will endure and so will the stock market.
1 When Will The Sun Die? JoAnna Wendel, published January, 7, 2022. Space.com.
2 https://www.macrotrends.net/1319/dow-jones-100-year-historical-chart
3 https://www.investopedia.com/ask/answers/100214/when-did-dow-jones-industrial-average-djia-begin.asp
4 Ibiid
5 https://en.wikipedia.org/wiki/S%26P_500
6 https://www.investopedia.com/articles/investing/090414/sp-500-index-you-need-know.asp
Midyear Outlook 2025
Volatility, as defined by Merriam-Webster, is “a tendency to change quickly and unpredictably” — a fitting description of the 2025 environment. The volatility has stemmed from assuming President Trump’s second term policies would mirror his first, as well as the subsequent impact of those new policy directions.
Watch Out For Your Emotions When Investing
Let’s face it, we all see headlines from time to time and it’s only human that they impact our mood. But with investing, our emotions can really trip us up.
Most people who are going to invest do it in one of two ways: They either do it themselves or they work with a professional. And regardless of the path, everyone can relate to the following graph:
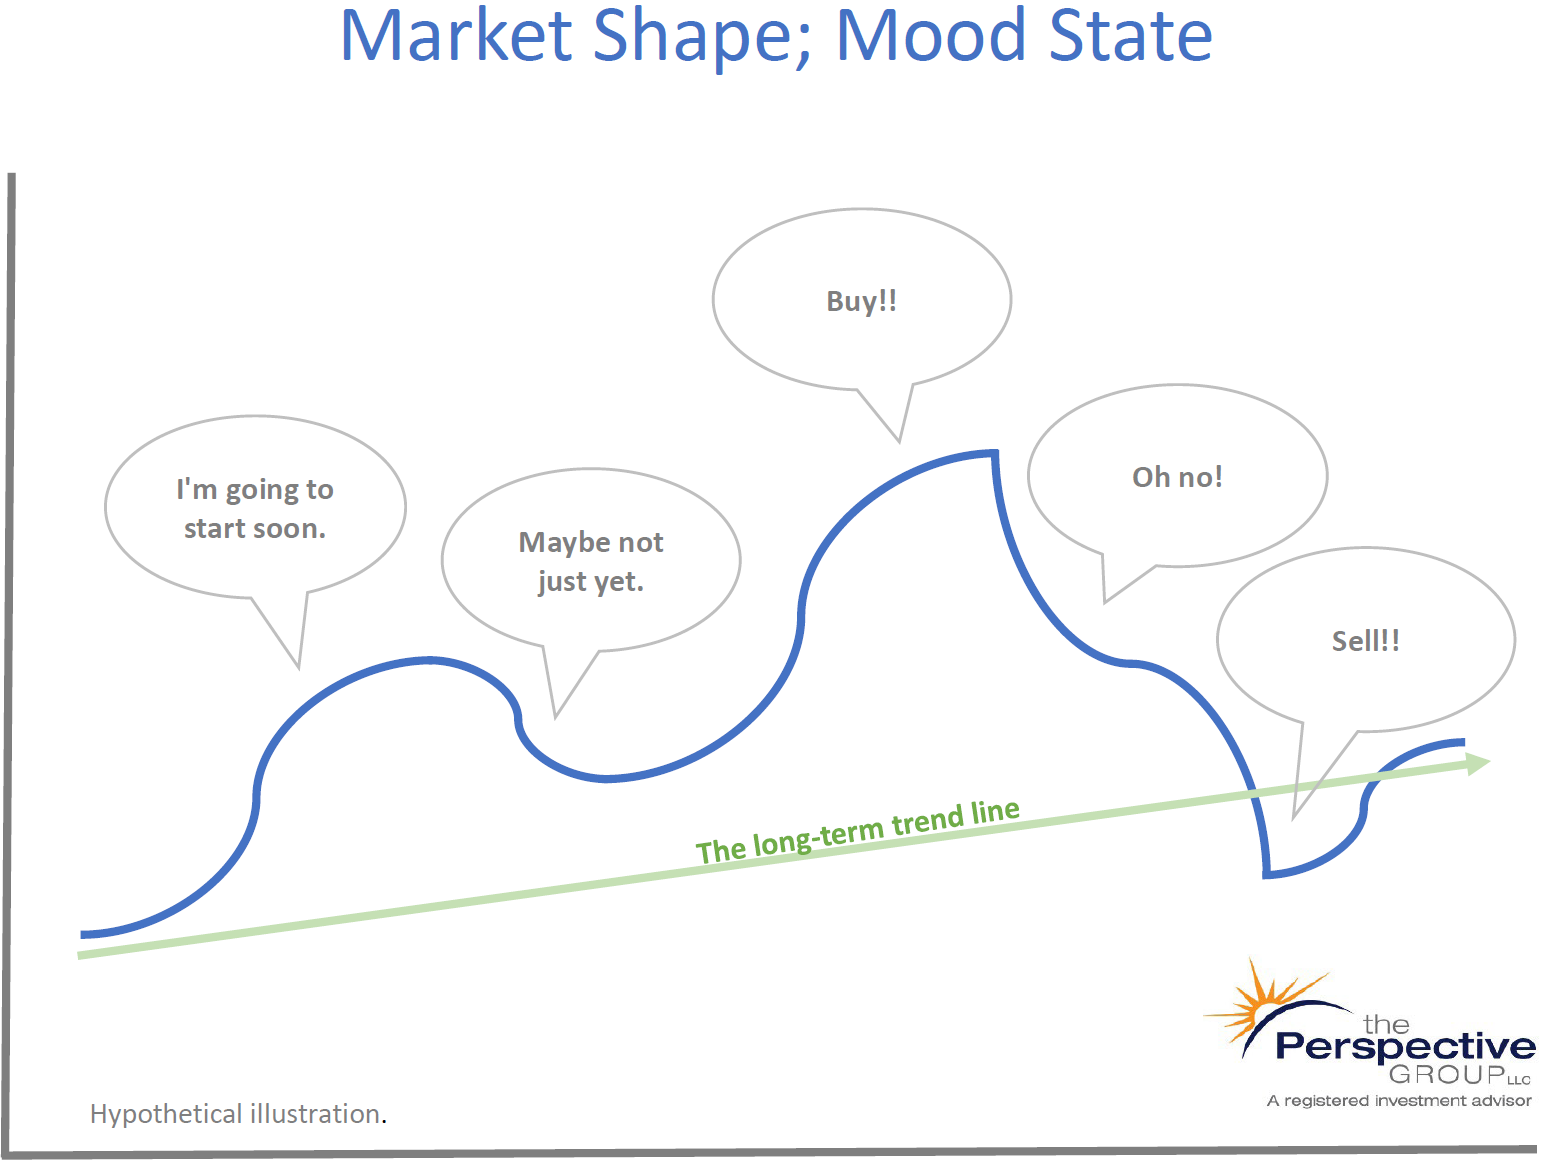
Whether it’s a single stock or the market in general, stock values will move in waves that can rise and fall and wreak havoc on your human psyche. Consider the hypothetical wave on this graph and imagine how you might feel as the market, in whatever asset you are following, moves up. It’s human nature to think, “I want some!” That also happens to be a favorite line of my nine-year old son when he sees me hand something to his five-year old brother. Apparently, these feelings are with us from an early age and carry on as we mature. I want some! So we’re drawn to invest as the market moves up.
As the wave moves higher, you start seeing and hearing reinforcements. That may come in the form of headlines, co-workers, or maybe even from a friend – or, even more emotionally alerting, in a peer-group setting. You’ve probably been in a situation where you heard a comment like, “Wow, I’ve made a lot on (pick your asset)! Are you buying some too?” Many people at this point will start to invest – the “Buy!!” moment.
Almost inevitably, the asset will start to decline when emotion meets reality. In our illustration, this is where many feel that “Oh no!” moment. But, wait, it can get worse – because guess what emotion gets our attention even more than “I want some”? You guessed it, FEAR! Now, all of a sudden we’re in fight or flight mode and our hormones are kicking in and short-circuiting our more rational self. “Sell!!” Ahh – relief. “At least it’s not going to decline any more. I ‘stopped the bleeding.’” And then, like a twisted trick, the price inevitably starts going up again…and perhaps the entire cycle repeats.
I’d like to think I’ve never fallen into this trap myself. But, such is how we learn. As they say, experience is the best teacher.
One way to potentially enjoy the experience of investing is to work with a professional who has learned (ideally through personal experience, academic training, and work experience) how to help you navigate investing and tries to help you increase the odds of making the most of your money.
A professional can offer several useful strategies to help an investor avoid the emotional roller-coaster ride depicted in the graph. One of these is investing a set amount on a consistent basis (the process known as “dollar-cost averaging.”). This removes the “When should I invest?” decision.
Another strategy is to invest in a diversified portfolio. While this portfolio can still follow a wave-pattern, it provides an opportunity to increase the potential that the wave (and your experience) will be less wild.
If you’d like to visit about how we would approach investing with you, please contact us.
Get Started Now
When I was in college, during my first accounting class, Professor Tim Shaftel, CPA, used a break in class to have a sidebar conversation. Prior to this, we were all taking notes on how to appropriately “debit and credit” something known as “T” accounts. For me at least, this wasn’t too exciting. But at the age of 20, I was about to wake up to the concept of compound earnings (a.k.a compound interest).
Professor Shaftel applied a jolt of electricity through me with his five-minute detour. He put up a slide that showed what happens when you invest from an early age and keep doing it every year. He made the assumption that you would earn 8% on your investment, and he ignored the impact of taxes. But what he revealed to me and the class that day changed my life. He used a simple table illustration to show how an investment of as little as $2,000 a year could turn into a million dollars after fifty years – figures I still remember to this day.
When should you, your kids, or your students start investing? Now! Let me build on the concept above and illustrate the difference between starting now and starting a bit later. (We won’t consider the third camp – those who never start.)
The following table illustrates what a consistent annual investment of $5,000 may become, assuming an 8% rate of return and ignoring taxes (for the sake of simplicity):
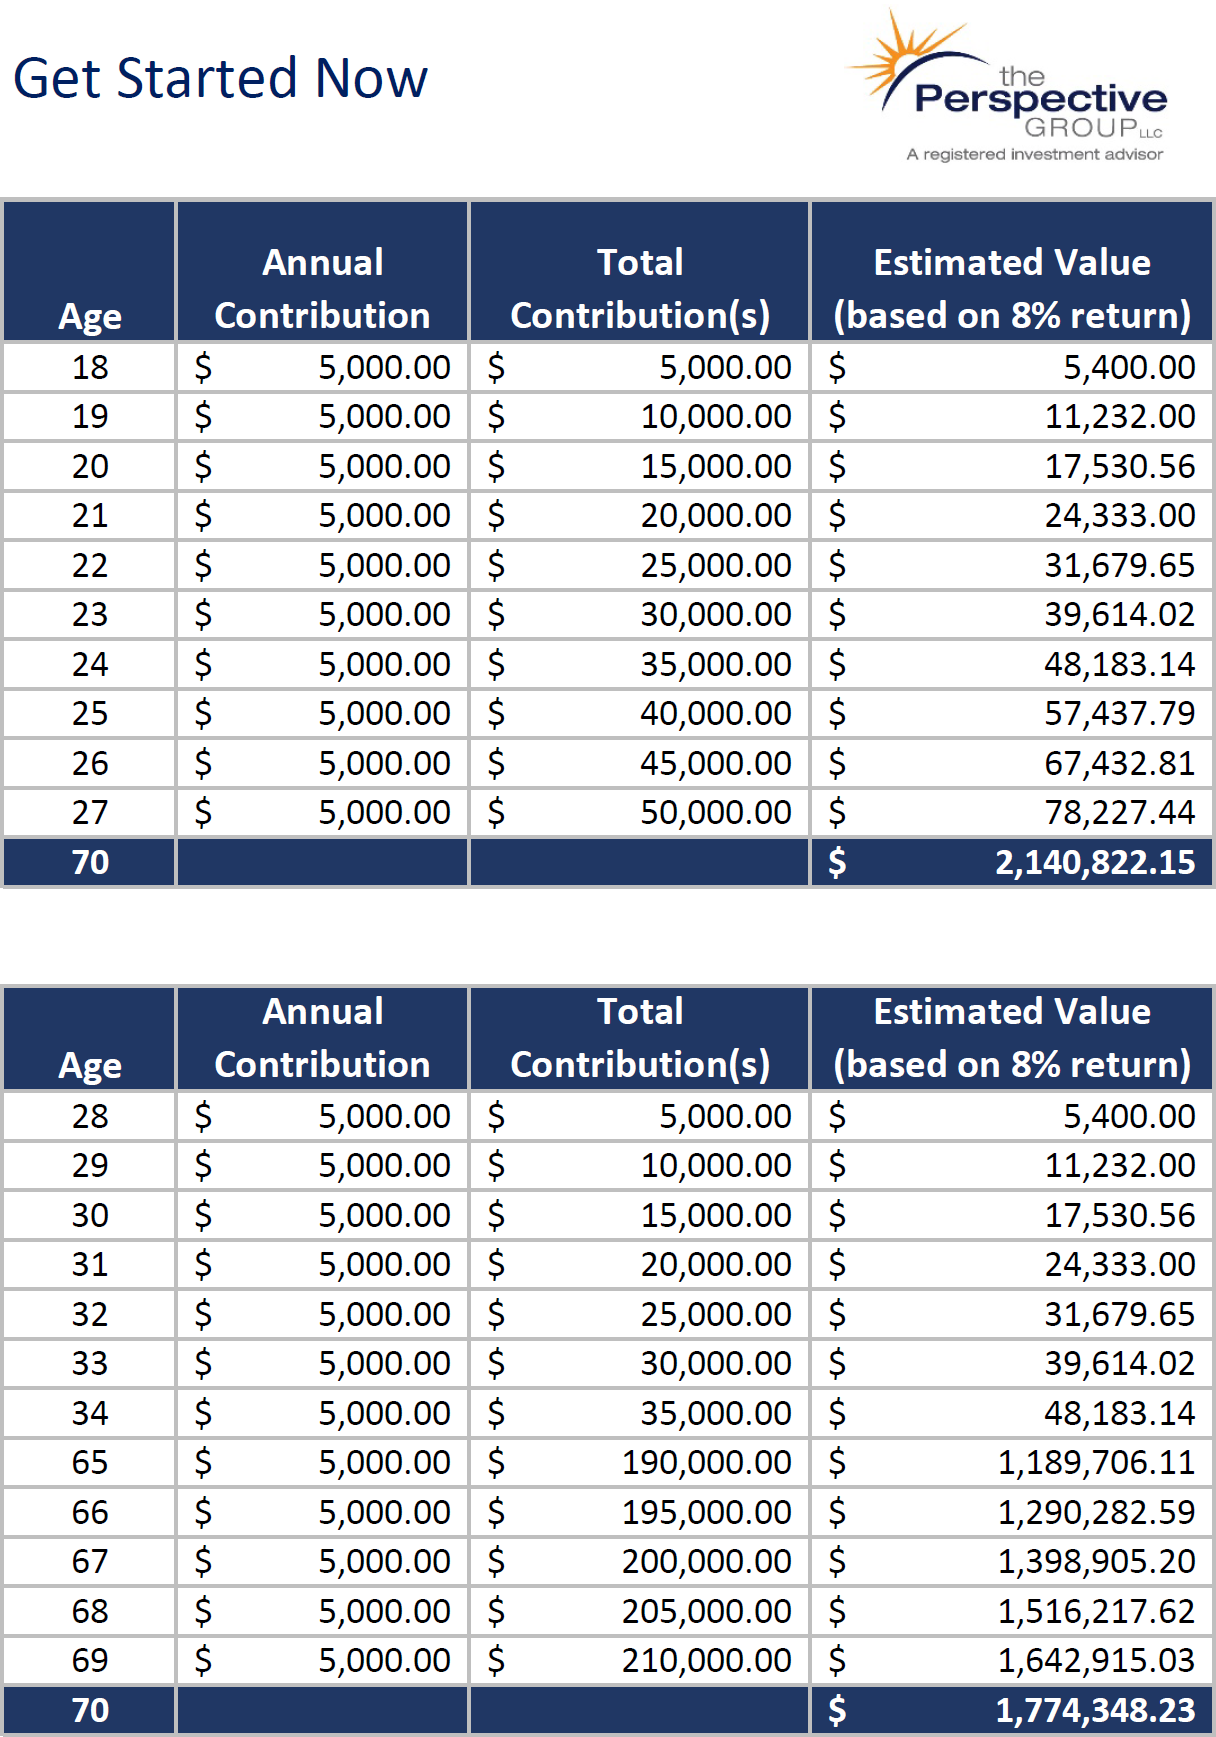
In the first table we see how compound earnings really start to add up. The person in this example contributed $5,000 a year from the age of 18 through 27 before stopping, for a total contribution of $50,000. Then, let compound earnings go to work and at the age of 70, she would have about $2.1 million! If this illustration gave you a bit of a zing (or jolt as it did me), now you know how I felt sitting there in the lecture. Needless to say, I had a hard time mentally returning to the class topic that day.
Contrast the first example with an individual who started saving at the age of 28 and made a habit of investing $5,000 per year for the next 42 years, until reaching age 70. That commitment worked well, and her investment reached a value of $1.77 million! That’s impressive – but you’ll also notice that she contributed $210,000, whereas the first person contributed “only” $50,000. Yes, the second person contributed more than four times as much…and ended up with 17% less. Compound interest (or compound earnings) rewards those who invest the longest.
If you’re wondering when is the right time to start investing, or when to encourage your children, grandchildren, friend, or student to start – consider sharing what you learned about compound earnings.
As our founding father Benjamin Franklin said, “Money makes money. And the money that money makes, makes money.”
If you’d like to visit about how we would approach investing with you, please contact us.
Pragmatic Optimism
Looking back, 2024 clearly echoed many of the themes from 2023. By and large, the economy continued to defy expectations and surprised once again to the upside. Stocks continued their strong performance, driven by powerful trends in artificial intelligence and technology. On the other hand, the bond market experienced another lackluster year amid policy ambiguity and uneasiness over rising debt levels.